
ABC PC Software
Start screen ABC PC program; ABC Server
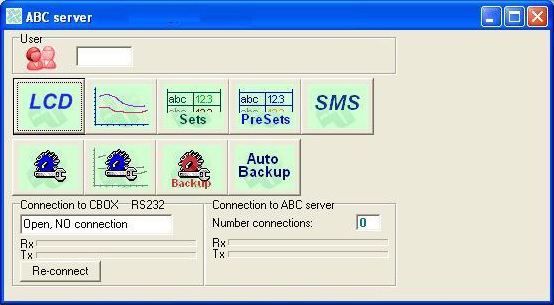
Description of icons:
 |
Code for user level |
 |
Open the ABC control screen on the PC. The screens and operation are equal to the LCD |
 |
Open the log data:
|
 |
Open the screen to configure data |
 |
Open the screen to record and call up ‘preset’ basic settings |
 |
Open configuration page of SMS module |
 |
Open page to configure connection between C-Box and PC (only user 3) |
 |
Open page to configure en check log data and settings. |
 |
Save current settings. The technician can restore current settings after maintenance or test. |
 |
Configure time at which settings will be automatically saved daily. In case of malfunction, failure or replacement of the C-Box, all settings of before the last ‘Backup’ can be restored directly. |
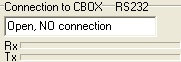 |
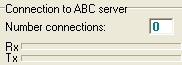
Type of connection PC with C-Box Status of connection Rx moving bars Tx |
 |
|
 |
Restore connection |
Control Screen on PC
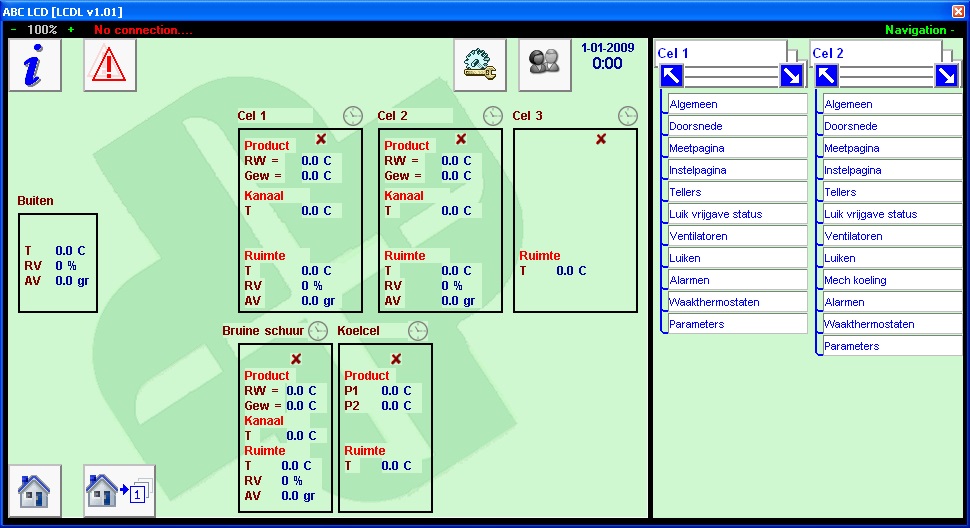
Control screen on PC with same layout as ABC touch screen.
Extras:
- Screen can be reduced to 33% and enlarged to 150%.
- Status specification of connection with C-Box
- Extra navigation screens;
- Click on ‘Navigation +’ to open 2 navigation screens.
- You can open the desired page directly from every navigation screen.
- Now you can easily open and compare 2 screens of random cells.
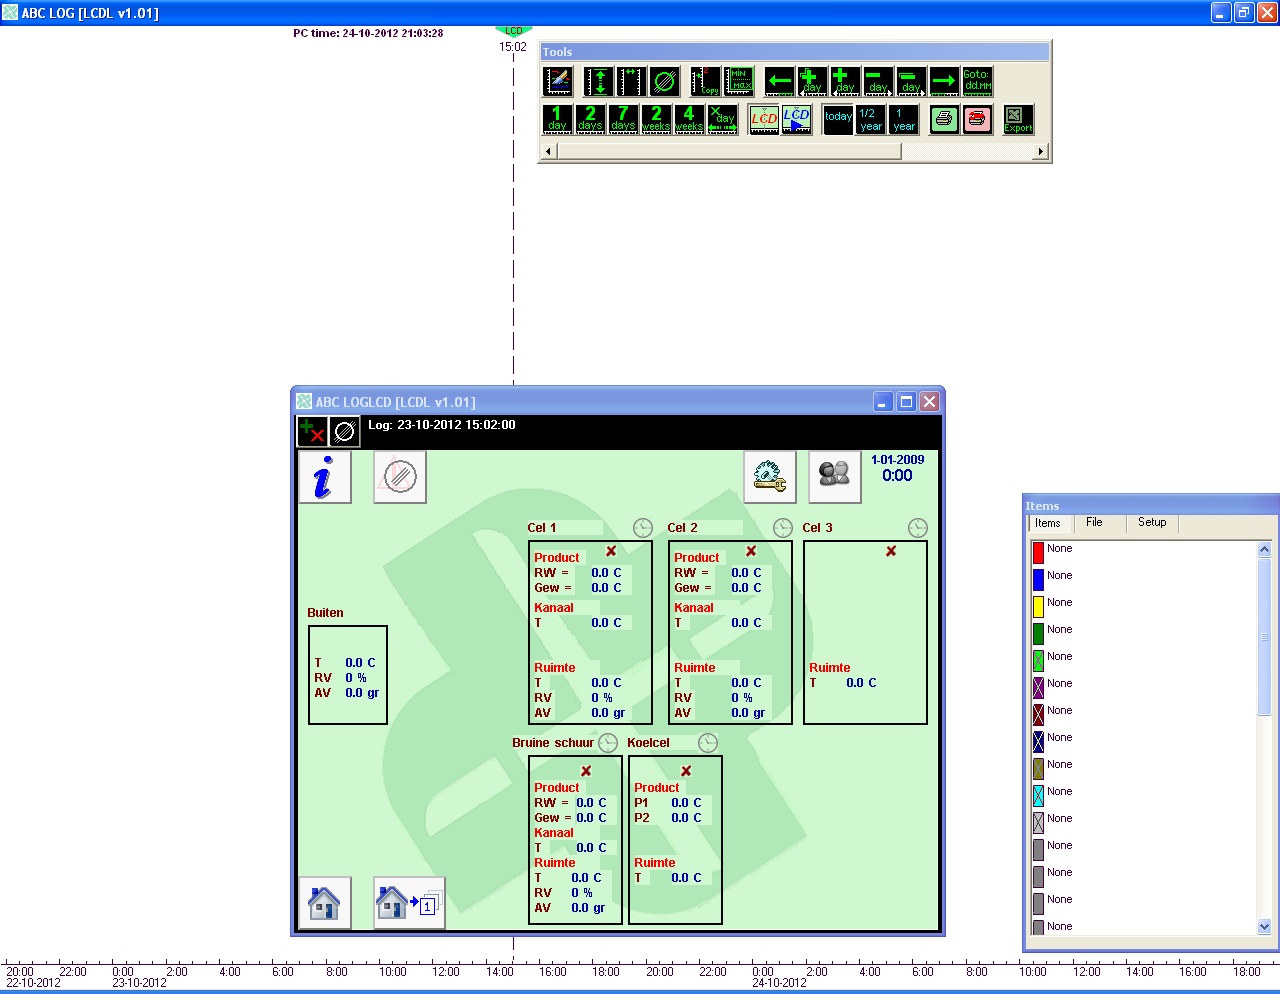
Click in the frame ‘Tools’ (above) on the ![]() button to open the Log screen at the chosen time. The dotted line and
button to open the Log screen at the chosen time. The dotted line and ![]() display the chosen time. All historic measurement and control data of that time are now visible on the screen. The time of the log screen can be changed by activating the dotted line and moving it, using the right mouse button.
display the chosen time. All historic measurement and control data of that time are now visible on the screen. The time of the log screen can be changed by activating the dotted line and moving it, using the right mouse button.
Click on the ![]() button in the left upper corner, to activate the measurement and control items of the screens and select them easily for the chart.
button in the left upper corner, to activate the measurement and control items of the screens and select them easily for the chart.
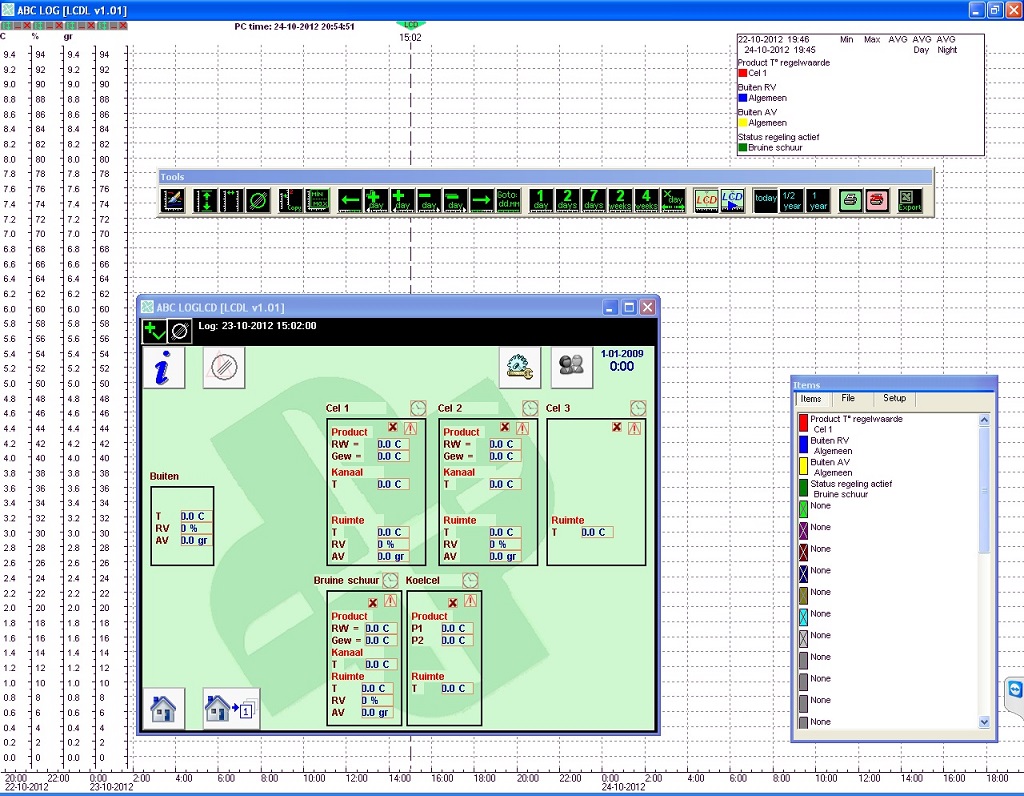
The 'log screen' is activated: ![]() . All measurement and control items, as well as ‘status’ and ‘alarm’ etc. have a red frame. Click on the frame to display this value in the chart. In the overview ‘Items’ the matching color of the value is displayed. Every quantity (°C, %, gr, ppm, status etc) has its own vertical axis.
. All measurement and control items, as well as ‘status’ and ‘alarm’ etc. have a red frame. Click on the frame to display this value in the chart. In the overview ‘Items’ the matching color of the value is displayed. Every quantity (°C, %, gr, ppm, status etc) has its own vertical axis.
- The axis will be displayed when a measurent value with the relevant quantity has been chosen.
- Use ‘shift+left mouse button’ to move the axis over the screen.
- Each axis can be individually scaled using the scroll wheel of the mouse.
- Use the
 button to adjust all scales optimally to the various measurement values.
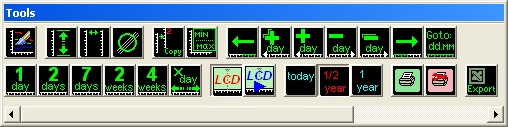
Control buttons for chart and LCD with log data.
 |
Redraw All | Chart will be supplemented with the latest log data |
 |
Fitt All | All scales are adjusted for optimal display |
 |
LineOutAxis |
All axis are replaced to start position |
 |
Clear all items |
All chosen items will be cleared; empty screen. |
 |
Extra Axis sml |
For mentioned quantity an extra axis is placed |
 |
MinMaxAVG |
The minimum, maximum and average values will be displayed of the time zone as displayed on the screen. |
 |
Shift half time axes |
The log display shifts half a page forward in time. |
 |
Plus 2 day sml |
The log display shifts 2 days forward. |
 |
Plus 1 day sml |
The log display shifts 1 day forward. |
 |
Min 1 day sml |
The log display shifts 1 day backward. |
 |
Min 2 day sml |
The log display shifts 2 days backward. |
 |
Min half tax sml |
The log display shifts half a page backward in time. |
 |
Goto ddmm day sml |
Go directly to log data of this desired date. |
 |
1 day sml |
Log display on the screen of 1 day 0:00 to 23:59 hours |
 |
2 days sml |
Log display on the screen of 2 days |
 |
7 days sml |
Log display on the screen of 7 days |
 |
2 weeks sml |
Log display on the screen of 2 weeks |
 |
4 weeks sml |
Log display on the screen of 4 weeks |
 |
Fit X days |
Display is adjusted to full days (0:00-23:59) |
 |
LCD sml |
Display of LCD on selected moment. All measurement and control values of that moment are visible |
 |
LCD sml play |
From the selected moment the LCD screen will shift automatically forward in time; measurement and control values will form a sequence. Changes in valve position, fans, colors, etc. are clearly visible on the LCD. |
 |
Log start from today |
Display of the log starting today. |
 |
Log start from half year ago |
Display log of half a year |
 |
Log start from one year ago |
Display log of a year |
 |
Print sml |
Print log data of displayed screen |
 |
Print setup sml |
Choose printer |
 |
Export to Excel |
Selected data is opened in Excel and can be saved as an Excel file. (see next: ‘Procedure to open log data in Excel‘) |
Procedure to open log data in Excel
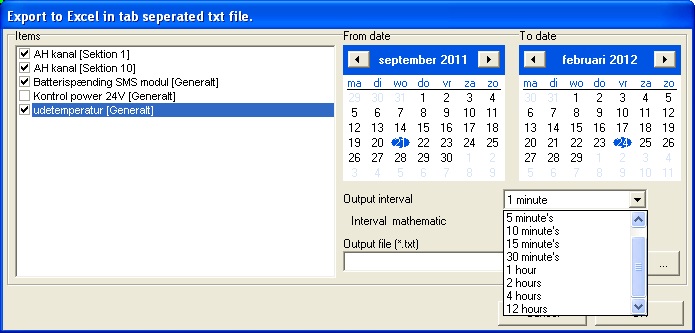
Click the ![]() button to open the following screen:
button to open the following screen:
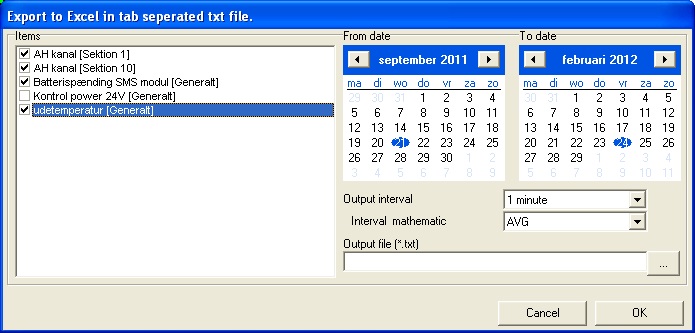
Procedure to open log data in Excel:
- Choose the desired items from the selected items to export to Excel.
- Choose the timeframe: ‘From date’ to ‘To date’
- Choose the interval related to the size of the file (measurement per minute)
- Choose the calculated value within the interval: Average, minimum, maximum
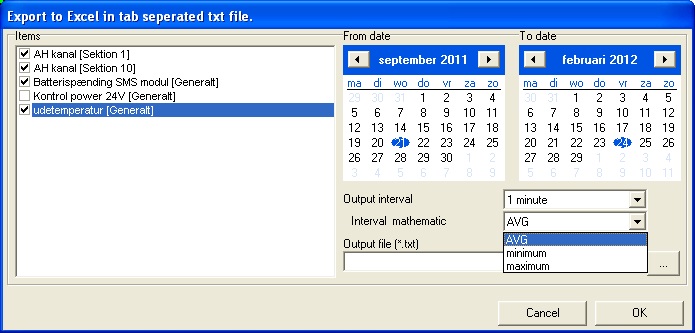
OK: Chosen measurement points are made visible with the configured interval in an Excel file